



How are soils data generated?
Holes dug in the ground
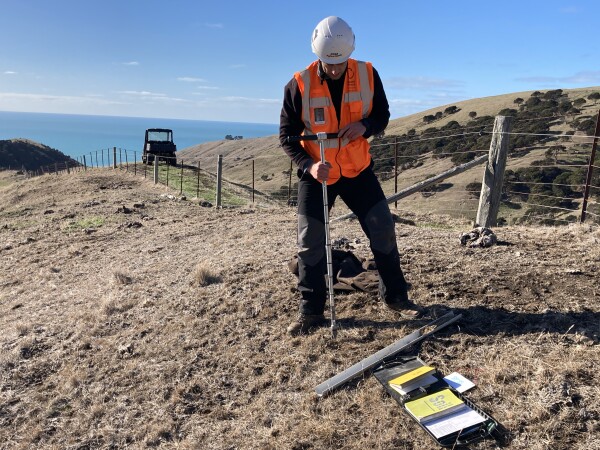
Soil survey on Banks Peninsula (2020)
When a soil scientist describes a soil in the field, they dig a hole, record its location, describe what they observe, take measurements, assign the soil a preliminary name, and collect samples for more detailed laboratory analyses. Most data gathered this way are stored in the National Soils Data Repository (NSDR). The physical soil samples are archived in the National Soils Archive.
The second technique used by soil scientists is a soil survey. As part of a survey, the soil scientist usually digs several holes and describes each one as before. They also observe the soil surface and look for clues that indicate changes below ground. The soil surveyor then names the different soils they identify and draws boundary lines on a map or aerial photograph to show where one soil changes to another. A soil survey usually results in a map at a particular scale, showing the distribution and pattern of soils in the landscape, together with a published report describing what the soil surveyor found and what it means. Modern soil survey maps are digitised and stored as computer-based maps in GIS, and digitised copies are also available for many older soil survey maps. To find out what surveys have been done and where they are, visit our soil survey pages.
National surveys of soil characteristics
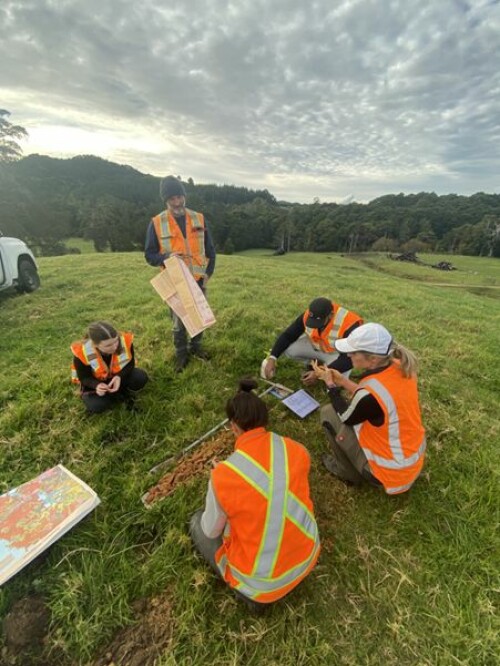
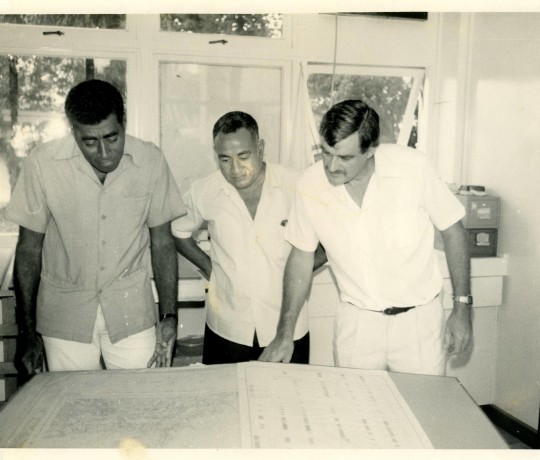
Group of soil surveyors describing a soil profile in Whangārei, Northland (photo: Emily McKay).
Over time, soil scientists have visited most parts of New Zealand and undertaken soil surveys. Some surveys are very detailed, while others are relatively simple, so there is now a substantial body of knowledge about soils throughout New Zealand. This knowledge was collected and synthesised into a single data layer known as the Fundamental Soils Layers (FSL). This GIS data layer contains the best available estimates for essential soil parameters across New Zealand, including pH, rooting depth, and carbon content, which are useful for national and regional environmental modelling.
More recently, work has focused on creating a new soils database. S-map is a digital soil spatial information system for New Zealand. It was originally created as part of the government-funded Spatial Information programme run by Manaaki Whenua. When complete, S-map will provide consistent and comprehensive national soil data layers to support applications from local and regional scales through to national scales. It builds on previous soil mapping by filling gaps with new mapping, upgrading information content, and improving associated databases to meet a new national standard. In time, S-map is expected to provide national coverage and contain predominantly new digital data at a scale that resolves soil variation on hill slopes, nominally 1:50,000.
The New Zealand Land Resource Inventory (NZLRI) also includes soil information. The NZLRI is a spatial database containing about 100,000 polygons (map units), each of which describes a parcel of land in terms of five characteristics or attributes (rock, soil, slope, erosion, vegetation). The data were derived from stereo aerial photograph interpretation, field verification, and measurement as part of the 1:63,360 and 1:50,000 scale NZLRI survey (Edition 1, 1972–1979; and Edition 2, 1988–1998, in four regions: Northland, Gisborne-East Coast, Wellington, and Marlborough), as well as from publicly available soil surveys.
Special purpose datasets
Sometimes particular projects collect large quantities of soil data in a way that warrants using a special database to store the results, examples of these are the "500 Soils", SWAMP, and "Carbon Monitoring System" projects, each of which have their own databases.
Overseas soils
Manaaki Whenua also has an interest in the soils of the Pacific and Antarctica. For more information, please visit our dedicated pages about Pacific soil data, and Antarctic soil data.