NZLRI development

The NZLRI mapped soil and land resources at the national scale.

Five key physical soil and land resource factors that drive land use capability were mapped, which included soil, rock type, slope, presence and severity of erosion, and vegetation (Lynn et al. 2009).

Hill country erosion.

The NZLRI is a powerful tool as it provides consistent coverage  across the entire country at a nominal scale of 1:50 000. This scale is likely to be too coarse for use in farm-planning activities. As such, Manaaki Whenua is currently in the process of mapping soil and land resources at a finer resolution through the S-map program in conjunction with regional councils.

The NZLRI maps an inventory of five physical factors:

  • Soil – A dominant soil type is mapped. The soil type units used in the NZLRI are based on the soils described in a number of previous soil surveys, (see Other Soil Surveys) particularly the General Survey of the Soils of the South Island, New Zealand and its sister publication, General Survey of the Soils of the North Island, New Zealand.
  • Rock – The rock type units of the NZLRI are based on the dominant rock type for the area in question.
  • Slope – The slope units of the NZLRI for an area are based on the dominant slope class of the area in question.
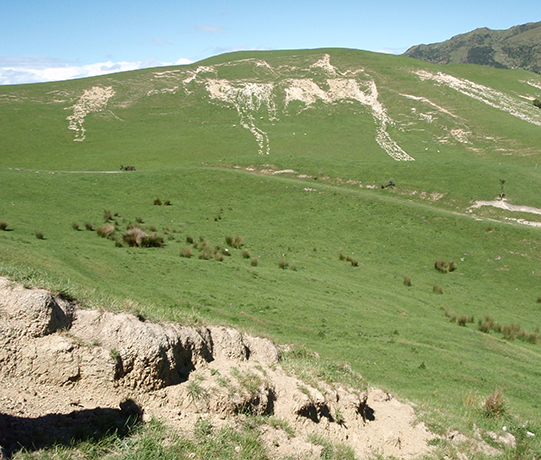
  • Erosion – Classes of present type and severity of erosion  are recorded for the area in question (see Section 2.4 and Appendix 2 of Lynn et al. 2009).
  • Vegetation cover – Vegetation cover using a national classification is recorded for the area in question (see Section 2.5 and Appendix 3 of Lynn et al. 2009).

As well as the five physical factors, a number of interpreted products are included:

  • Land Use Capability (LUC) assessments — LUC assessments rate the ability of each polygon to sustain agricultural and forestry production, based on an assessment of the inventory factors above, climate, the effects of past land use, and the potential for erosion. The NZLRI covers the country in 11 regions, each with a separate LUC classification.
  • Derived Fundamental Data Layers (FDLs) and Fundamental soil layers (FSL) — contains data for 16 key soil attributes nationally.
  • Pastoral and forestry production parameters, plus administrative and natural boundaries.

These products in combination are highly flexible in allowing comparative land use studies within a wide range of national or regional areas.

Development of the NZLRI

The methods used to develop the NZLRI involved stereoscopic analysis of aerial photographs and field verification. Land considered to have dominantly uniform rock type, soil, and slope characteristics were  delineated according to surface geology, geomorphology, and soils. Erosion and vegetation categories are used to further subdivide units. Extensive field work and consultation with land managers followed to check delineated units. The final map unit boundaries, inventory codes, and LUC assessments were compiled onto a base map. Adjacent units differ in one or more inventory factors. Completed and checked maps were published as the NZLRI worksheets.

The first edition NZLRI provides national coverage from mapping between 1973 and 1979 at a scale of 1:63,360. A second edition(1992-1999) included regional upgrades at a scale of 1:50,000. The third edition in 2000 contained a restructured polygon attribute table to allow the core NZLRI to complement the newly created fundamental soil layers with minimal duplication.

The NZLRI spatial database contains the same information as the NZLRI worksheets. There are about 100 000 polygons (map units) within the NZLRI, each of which describes a parcel of land in terms of five characteristics or attributes (rock type, soil, slope, present erosion type and severity, vegetation). Soil information is adapted from publicly available soil surveys produced by Manaaki Whenua and its predecessor organisations.


How can NZLRI be used

Inventory, land-use capability and extended legend information can be used in planning at national, regional, district, and catchment levels. On a national level, for example, Electricorp via a consortium of consultants, used the NZLRI to plan a corridor for routeing new transmission lines. NZLRI was used because it was the only complete computerised land database for New Zealand. Planning the corridor required accessing NZLRI information on potential erosion, rock type, LUC class, slope, and vegetation cover for 10 million hectares, from Otago to Auckland. Thousands of work hours were saved using NZLRI.

At a regional level, an innovative study of Taranaki sustainable land used for land-use monitoring purposes was developed from the NZLRI and LUC information. Slope and aspect were identified as key factors determining sustainability. Many district councils have incorporated NZLRI data into their district schemes. Remapping at more detailed scale of 1:50 000 is making the material even more useful to local authorities.

Lynn IH, Manderson AK, Page MJ, Harmsworth GR, Eyles GO, Douglas GB, Mackay AD, Newsome PJF 2009. Land Use Capability survey handbook – a New Zealand handbook for the classification of land. 3rd edition. AgResearch Hamilton; Manaaki Whenua Lincoln; GNS Science Lower Hutt, New Zealand.

Please note: Hardcopies of the revised 3rd edition (2021) are available for purchase through the NZSSS.