Making sense of soil data
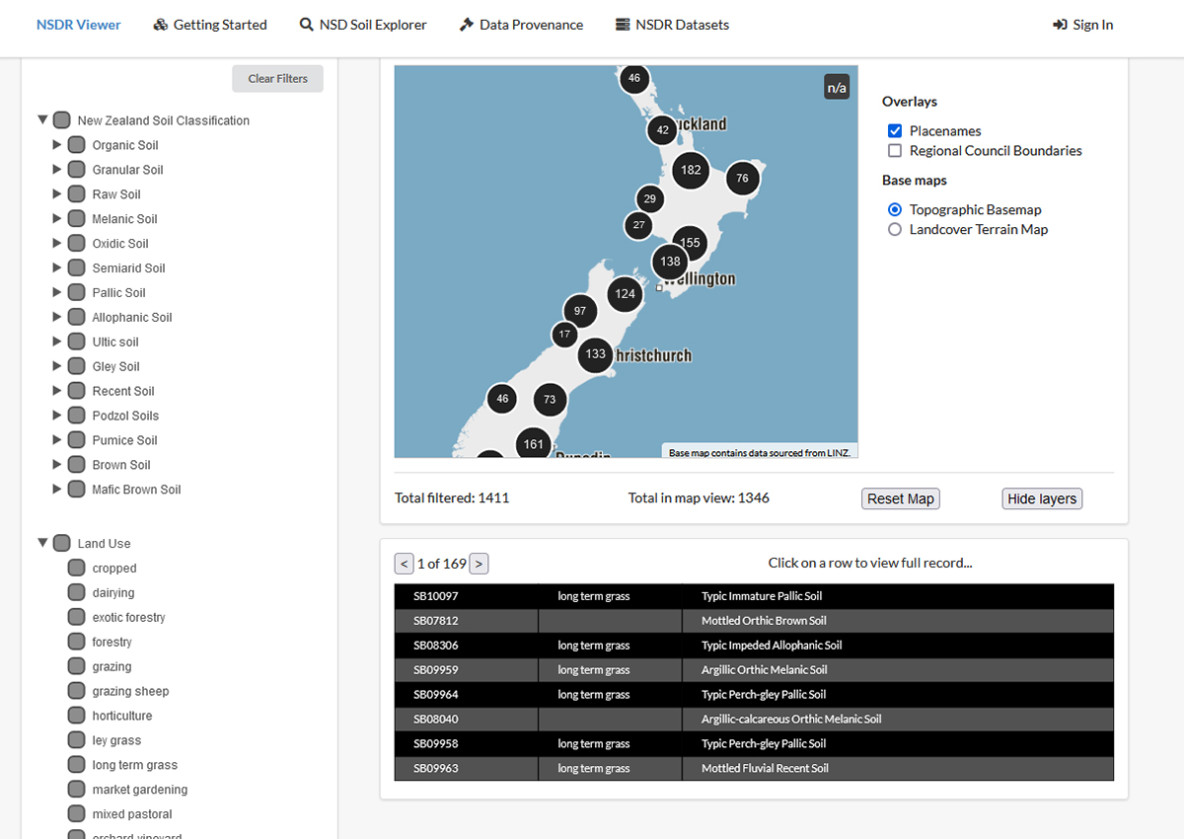
'I cannot conceive of the time when knowledge of soils will be complete. Our expectation is that our successors will build on what has been done, as we are building on the work of our predecessors.'

R.S. Smith, Director of the Illinois Soil Survey, 1928

The different types of soil data

Basically, there are two main types of soil data: soil point information and soil maps. Soil point information is raw data that are collected from digging and describing a soil pit at a particular location. If soil samples are taken and analysed, those lab results are part of the soil point information, too. In soil surveys, pedologists use augers and spades to collect a minimum soils data set at many different locations within a short time. You can best explore this type of soil information using the viewer of the National Soil Data Repository (NSDR).

NSDR Viewer

National Soil Data Repository (NSDR)

Using this website you can view soil observations from the National Soils Database (NSD), a dataset within the National Soils Data Repository. The NSD is a 'point' database containing descriptions of about 1,500 New Zealand soil profiles, together with their chemical, physical, and mineralogical characteristics. The information is obtained from excavated pits usually up to 1.5 m deep but sometimes deeper, from which the soil scientists collect samples for chemical and physical analyses.

At Manaaki Whenua, soil point information collected in soil surveys (see example here) is used to delineate different soil types. This creates separate areas of soil information, which you can see as ‘polygons’ of different colour on soil maps. Even with soil mapping it is impossible to check on soils everywhere, so the available information has to be extrapolated to produce soil maps for larger areas of interest. If you are interested in soil maps, use our S-map Online service.

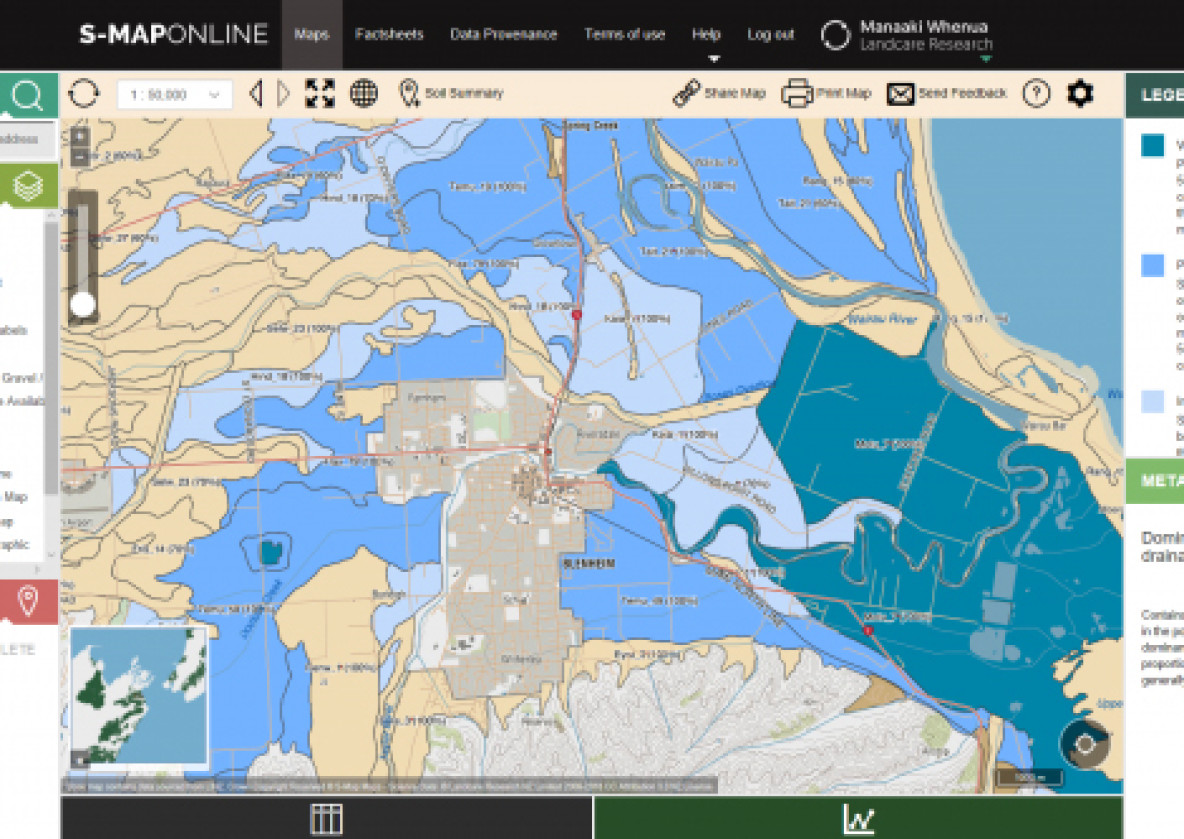
S-map is a digital soil map for Aotearoa New Zealand. S-map’s goal is to provide precise and accurate soil information to support sustainable management of our soil resource.

S-map online

S-map displays basic soil property data like depth, stoniness, and clay content, as well as more complex data like water holding capacity and nitrogen leaching risk. S-map is generated by expert soil surveyors, assisted by historical soil mapping and innovative new data sources.


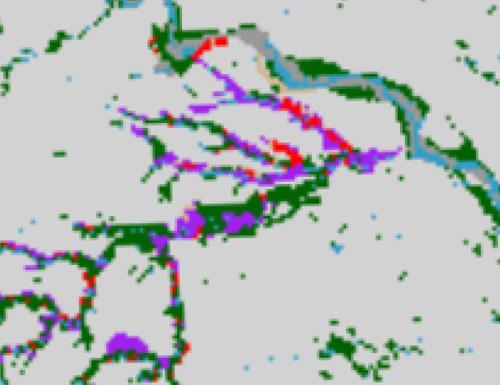
Example of a pixel-based raster map. Source: MfE. Erosion risk North Island 2012. https://data.mfe.govt.nz/layer/53177-erosion-risk-north-island-2012/

In the last 15 years, information technology (IT) has dramatically changed the production, handling and use of soil information. A new discipline called digital soil mapping (DSM) or pedometric mapping has evolved, and in many parts of the world it is complementing or even replacing labour-intensive and costly traditional soil survey methods. In a nutshell, DSM is the production of digital maps using computer-assisted tools and models.

Digital soil mapping can produce raster or "gridded" data, i.e. data that are saved in pixels. Each pixel represents an area on the Earth's surface. For example in the raster image below, each pixel represents a particular soil erosion risk class that would be found in that location in the real world.

To give another example, Manaaki Whenua is using so-called pedo-transfer functions (PTFs) to calculate soil hydraulic properties (for example, water release characteristics or hydraulic conductivity) for locations where they are unavailable. This is done by feeding a mathematical model with readily available soil information from field observations, along with corresponding detailed laboratory measurements of soil hydraulic properties. Then, based on field and laboratory data, a function is chosen to estimate soil hydraulic parameters for other soils with similar field information.