Proximal sensing laboratory
Why proximal sensing?
Standard laboratory measurements are a fundamental pillar for the study of soil and its processes. Nonetheless they are often expensive and time consuming, limiting the number of samples that can be analysed. If the research objective is assessing and mapping soil variability, either at farm or national scale, this limitation can preclude a project to fully developed or to reach its objectives.
At Manaaki Whenua, we recognized the importance to capture soil variability and we embarked in the exploration and implementation of new techniques that trade off an extremely high degree of accuracy (typical of laboratory methods) for the potential of analysing a greater dataset, rapidly and at the same cost. These new techniques have been developing since the end of the last century, trying to respond to the increasing urge for cost-effective methods to analyse soil.
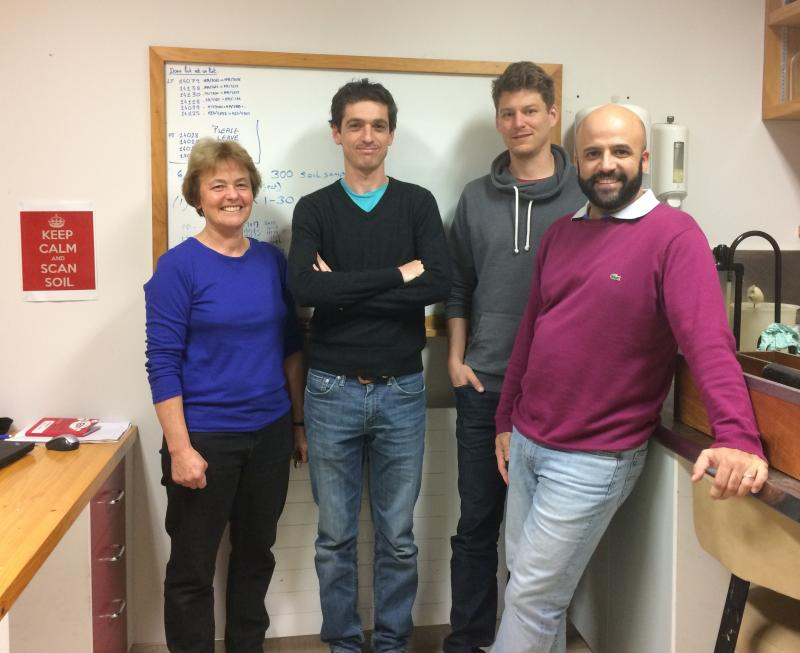
Manaaki Whenua's soil quantitative and pedometrics team. From left, Dr Carolyn Hedley, Dr Pierre Roudier, Dr Michael Blaschek and Dr Matteo Poggio.
Different techniques available
The most common approaches to develop sensing techniques are based on the study of the interaction between electric current or electromagnetic (EM) energy with soils. The electromagnetic spectrum ranges from gamma rays (high frequency, high energy and small wavelength) to radio waves (low energy, low frequency and great wavelength), with the visible portion, detected by human eyes, forming a very small portion of the entire EM spectrum.
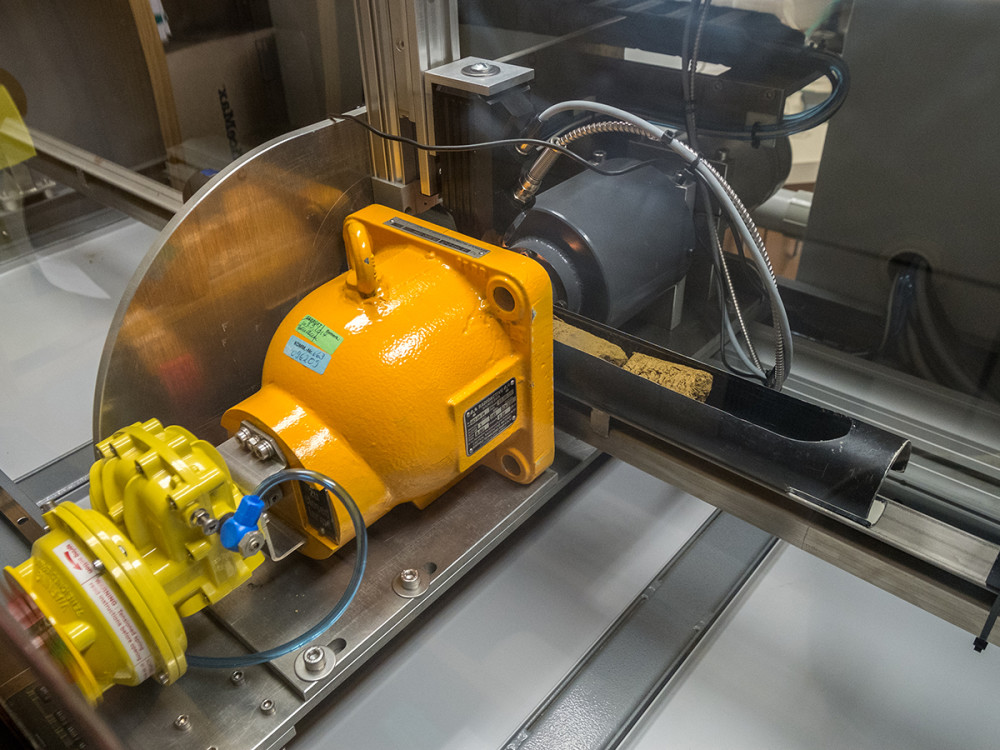
Several of these EM spectrum portions have been proved to be useful to estimate soil properties: at MW, we possess a gamma-ray attenuation sensor to measure the bulk density of intact core. In simple terms, the active source of gamma rays shines a beam of high energy photons through the material. These photons interact with the material, losing their energy. The denser the material, more photons are attenuated and don’t pass through the material. On the other side of the core, a detector “counts” the photons and from a calibration equation, we can determine the density of the material.
The sensor’s head of the SCANS multi-sensing platform is composed by the active gamma-rays source (on the left), the gamma-rays detector (on the right) and the Analytical Spectral Device (ASD Inc., Boulder, Colorado, United States) high intensity contact probe collecting the spectra (in the centre).
Manaaki Whenua ahead of the game in New Zealand
The application of diffuse reflectance spectroscopy (DRS) to soil analysis has received particular interest and attention in the last two decades and important organizations such as the United Nation's Food and Agriculture Organisation (FAO) have recognized its potential in soil analysis. This methodology has a long history and its first application to soil science dates back to end of the 1950s.
Manaaki Whenua began to investigate possible applications more than 10 years ago. We now have at our disposal an array of sensors, unique in New Zealand. The theory behind DRS is intuitive and can be explain by colours association: in front of a soil profile with a dark brown top soil, we are inclined to associate this particular aspect to abundance of organic material or high water content. This is because these soil components tend to absorb the light and reflect minimal part of it. Similarly, in front of a soil horizon with white dots or a strong red colours, we suspect the presence of carbonates or iron minerals, respectively.
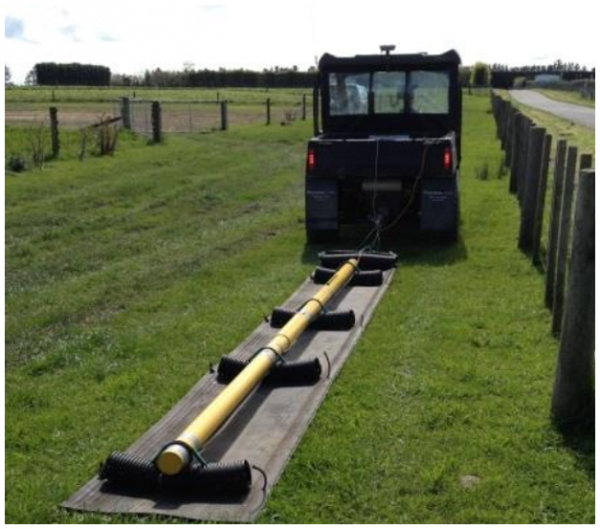
On-the-go electromagnetic induction (EMI) survey conducted with a Dualem (Milton, Ontario, Canada) sensor. Due to the inside configuration of the sensor, the data collected referred to the soil profile to up 6m depth.